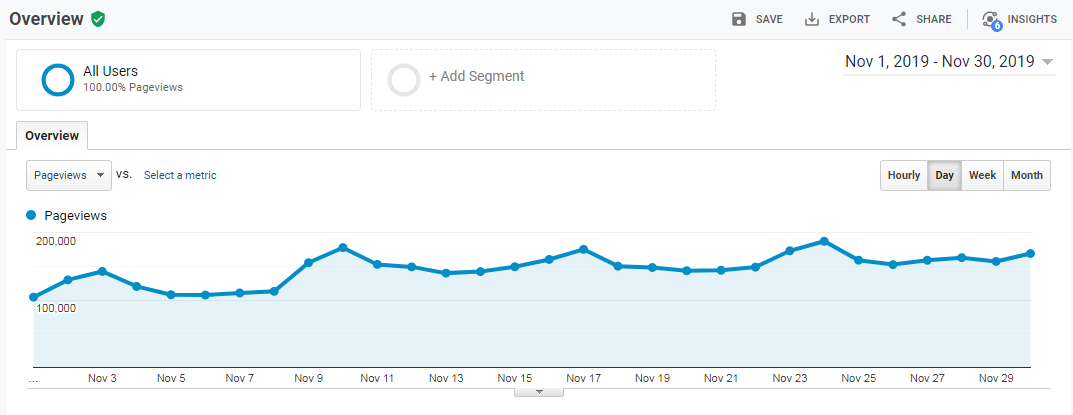
Earlier, I struggled to understand and monitor the server bandwidth and network traffic usage for my DigitalOcean server. Now they have added the feature to view the bandwidth usage in their billing section.
But this was when the bandwidth usage was not available anywhere in their console, and I wanted to know my exact usage and whether I was surpassing the network usage.
However, I feel sharing this Ubuntu command still makes sense in case you’ve any other cloud hosting server apart from DigitalOcean that does not share the network traffic and bandwidth usage.
I did research, and a lot of trial runs to find the best Ubuntu service app that will not only help share real-time stats but also provide an estimate of my usage and maintain historical usage info. Then I stumbled upon the vnstat command.
What is VNSTAT?
According to their developer source —
vnStat is a console-based network traffic monitor for Linux and BSD that keeps a log of network traffic for the selected interface(s). It uses the network interface statistics provided by the kernel as an information source. This means that vnStat won’t actually be sniffing any traffic and also ensures light use of system resources.
As it says, the vnstat sources the information from the kernel and doesn’t track the inbound or outgoing traffic at the network level. It makes it a lighter app service that doesn’t consume any background core or processing. Cool, isn’t it?
How to install vnStat via terminal?
vnStat is supported by Linux and BSD-based open-source operating systems. You can easily install it on Ubuntu, CentOS, Debian, and various other operating systems. For Ubuntu, you can follow the below command lines:
sudo apt-get install vnstat
The above command will automatically download and install the latest available vnstat utility on your Ubuntu server. Continue next command
vnstat
After installation, the above command will verify whether or not the vnstat is correctly installed. If you are watching any error like the command ‘vnstat’ not found, try rebooting your server and installing again with the previous installation command.
sudo service vnstat start
Once you verify the correct utility installation, start the vnstat service with the above command, as it needs to be manually started.
In some cases, the utility program is autostarted by running the above command. But, there is no harm in hitting the command again and again.
Monitor server bandwidth usage with the command line
The vnStat utility starts monitoring network traffic from the day or time it’s installed in the system. To begin with basics, type and hit the below command for initialization.
vnstat -l
OR
vnstat -live
The command will start displaying the live traffic on your network interface with inbound and outbound traffic details in real time. To stop, hit CTRL+C on your machine, and it will show the summary of live traffic.
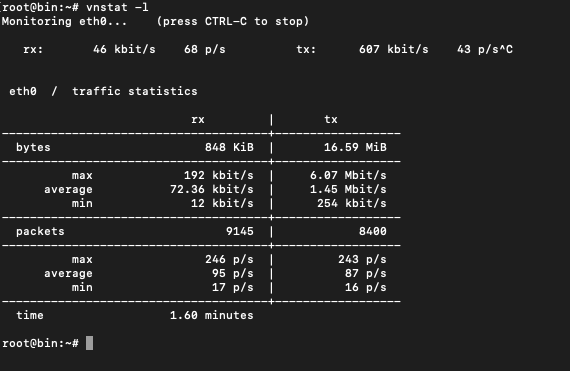
If you look at the above screengrab for 1.60 minutes, my network interface eth0 has used:
- 846 Kilobytes of the inbound traffic request with 12 kbit/s min and 192 kbit/s max
- 16.59 Megabytes of outbound traffic response with a 1.45 Mbit/s average
After a day or two, you should hit the below command in the terminal to get the daily, monthly and total server bandwidth usage and estimate for the day and month.
vnstat
The output will be something like this:
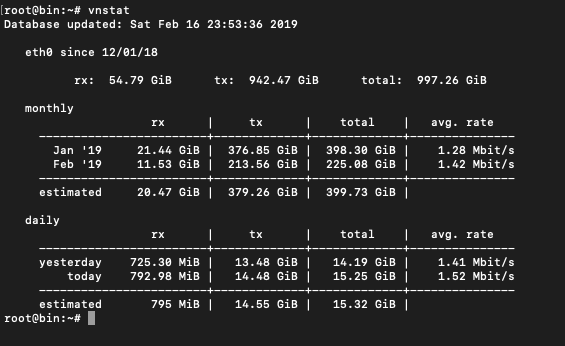
The vnstat supports a few other command options discussed in the next heading, but I guess these two commands will suffice most of the needs.
List of command options in the vnStat monitor
If you hit the command vnstat -help in the Ubuntu terminal, you will have the complete supported option list and the descriptor for each option.
Here is the list of command options supported for vnstat:
| -q, | –query | query database |
| -h, | –hours | show hours |
| -d, | –days | show days |
| -m, | –months | show months |
| -w, | –weeks | show weeks |
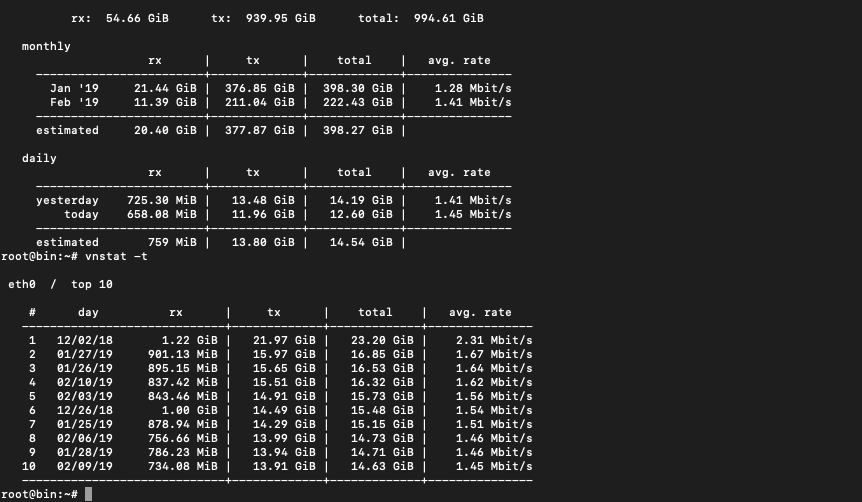
| -t, | –top10 | show the top 10 days |
| -s, | –short | use short output |
| -u, | –update | update database |
| -i, | –iface | select interface (default: eth0) |
| -?, | –help | short help |
| -v, | –version | show version |
| -tr, | –traffic | calculate traffic |
| -ru, | –rateunit | swap configured rate unit |
| -l, | –live | show transfer rate in real-time |
If you’re interested in exploring other extended options, type the vnstat -longhelp command for additional help.
Why do I like vnStat compared to other services?
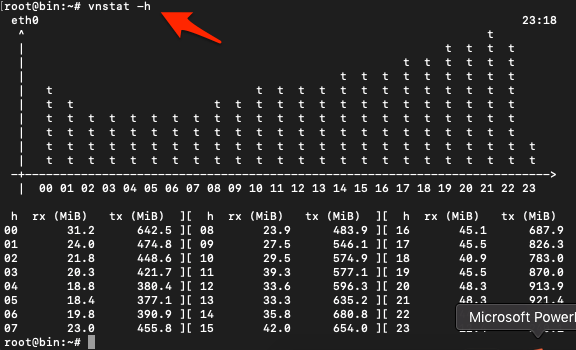
Short answer — it is light but robust and fully satisfies my need for being a network traffic monitor. It is like an on-the-go service that helps in providing real-time traffic usage on your network node. I especially like the hour command: vnstat -h, the help plot the network traffic over a day.
It looks like the below screenshot:
Bottom Line: Server Bandwidth Usage
I’d recommend using the vnStat program for your Linux or Ubuntu-based online server to monitor the server bandwidth and network traffic usage without worries.
You can cross-validate the usage billing from your cloud host or VPS provider with vnStat data. No sudden shocks!
F.A.Q: Server Bandwidth Estimate
We have listed some of the frequently asked questions related to server bandwidth estimates:
How to track real-time bandwidth usage on the Ubuntu server?
We can install and use the VNSTAT program on the Ubuntu server to track the network traffic and bandwidth usage through the network interface and also display the real-time usage. Use the ‘vnstat -live’ command for real-time usage.
How to check last month’s bandwidth usage using the VNSTAT command line?
We can use the command ‘vnstat -m’ to show the monthly bandwidth history.
What is VNSTAT?
vnStat is a console-based network traffic monitor for Linux and BSD that keeps a log of network traffic for the selected interface(s).